Here are the steps to build a chart or slide using think-cell:
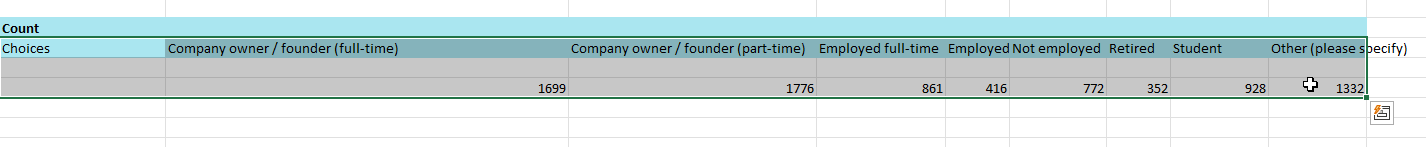
Step 1: In Excel, select the data you want to use.
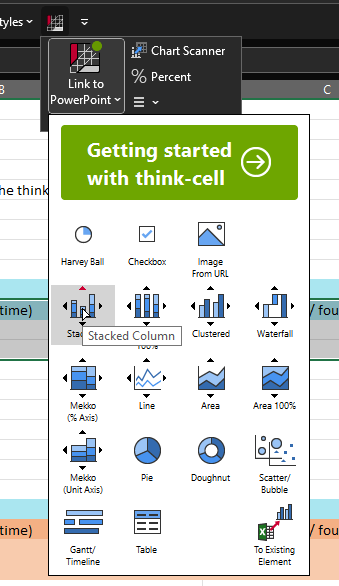
Step 2: With the data highlighted, click the think-cell icon and select the type of chart you want to create.
Step 3: You will automatically be switched from Excel to PowerPoint.

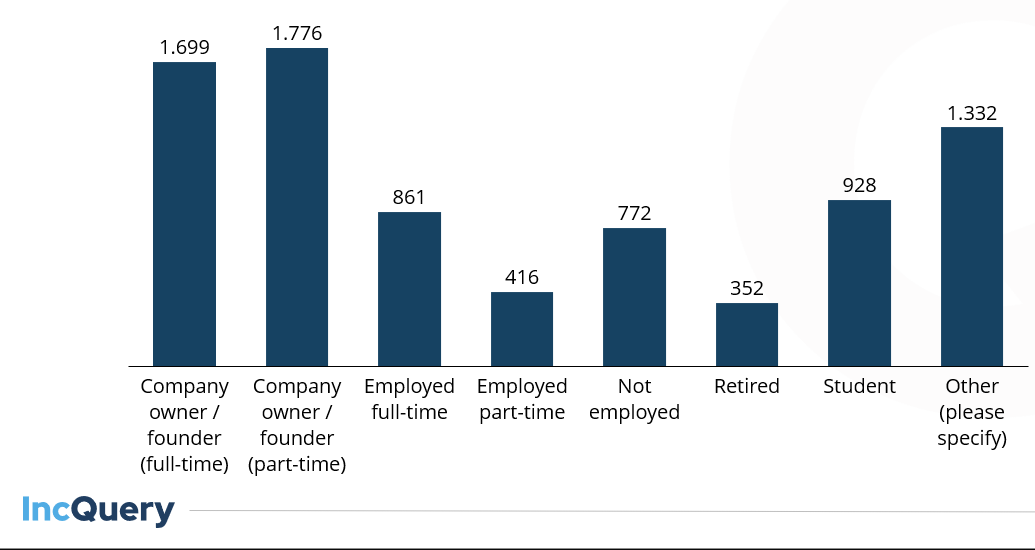
Step 4: Click on the area where you want the chart to go. think-cell will insert a graph based on your selected data and chart type.
Tip: If the visualization isn’t what you expect, try transposing the data from rows to columns (or vice versa) or selecting a subset of the data.